Coinbase Talent Dynamics
Today I want to explore the talent signals for the health and company dynamics for Coinbase.
The most important employee health metric is probably employee retention.
Employee Retention
Observation:
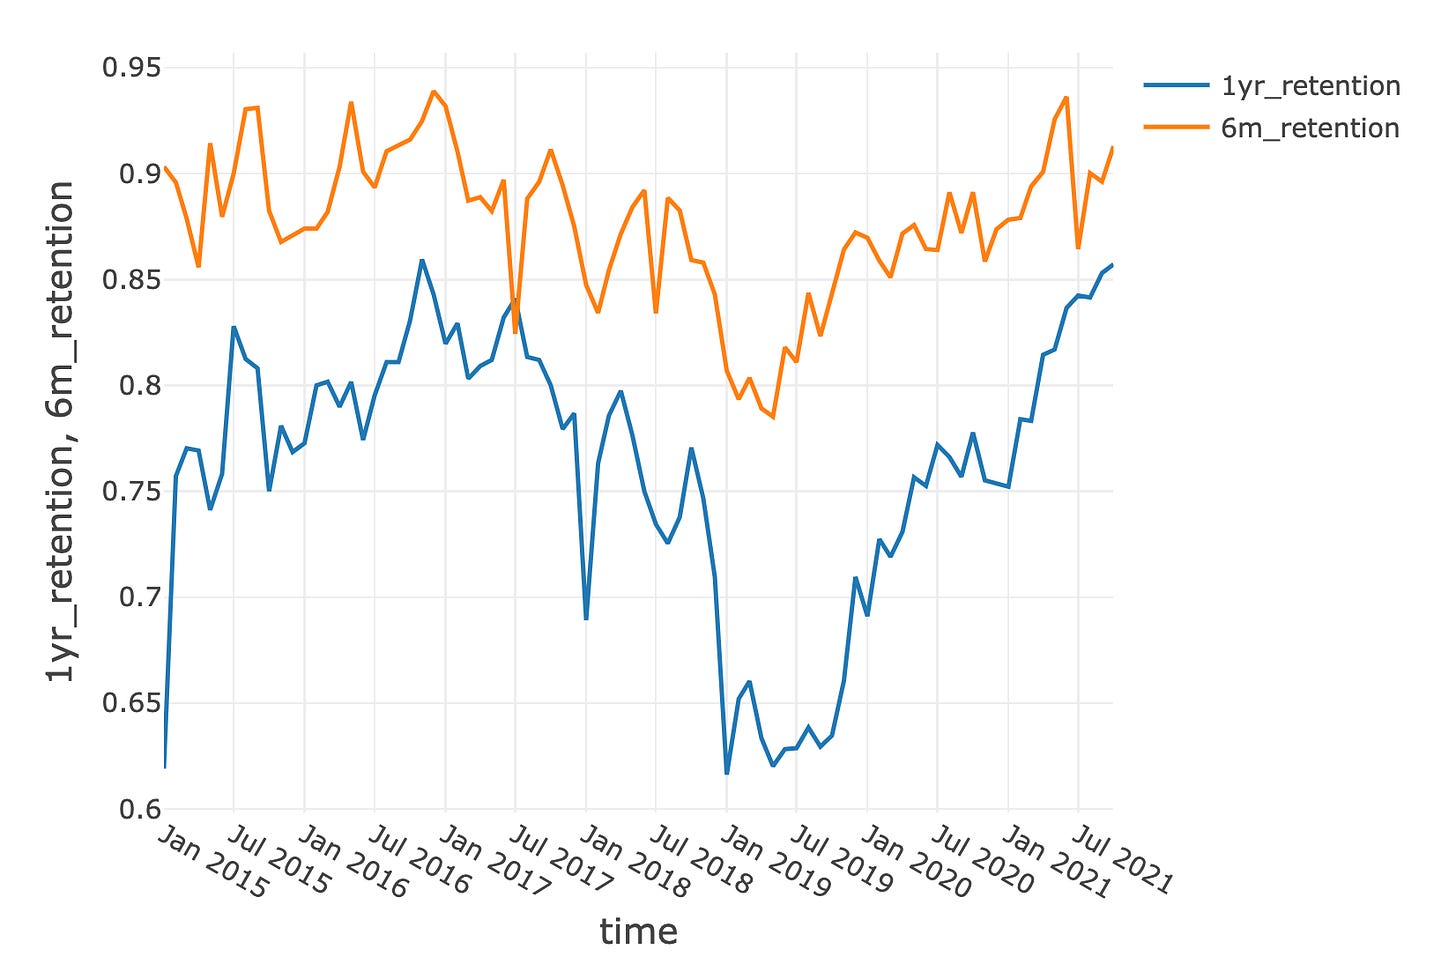
The employee 6-month retention rate sees visible drop around Jan 2019. More than 20% of the employee that were still employed in summer of 2018 left the company.
Similarly, we see a more dramatic effect for 1-year retention. The employee 1-year retention rate started to drop sharply starting Summer of 2018 and remained low through 2019 and picked up in late 2019. At low point, nearly 38% of the employees that were in the company 1 year ago were gone.
Retention improved as Coinbase got closer to its IPO. Coinbase went public in April 2021. We can see that after the dark period, starting in late 2019, retention improves greatly, and held strong in to 2021. Employees, likely encouraged by the internal movements of preparing to go public, mostly decided to stay for that short period of time.
The most interesting part of this graph is around April 2021 to July 2021 time where 6-month retention dropped ~7%, but the 1-year retention held almost flat. My best guess is that recent hires are not happy that their RSU package were given at 80B valuation, but the company valuation is floating around 40B after IPO. Because this means their stock comp is half of before. Comment below if you have better hypothesis.
Coinbase ended the year 2021 with more than 85% employee 1-year retention. Probably its all time high.
Hiring, Attrition and Active Employee Count
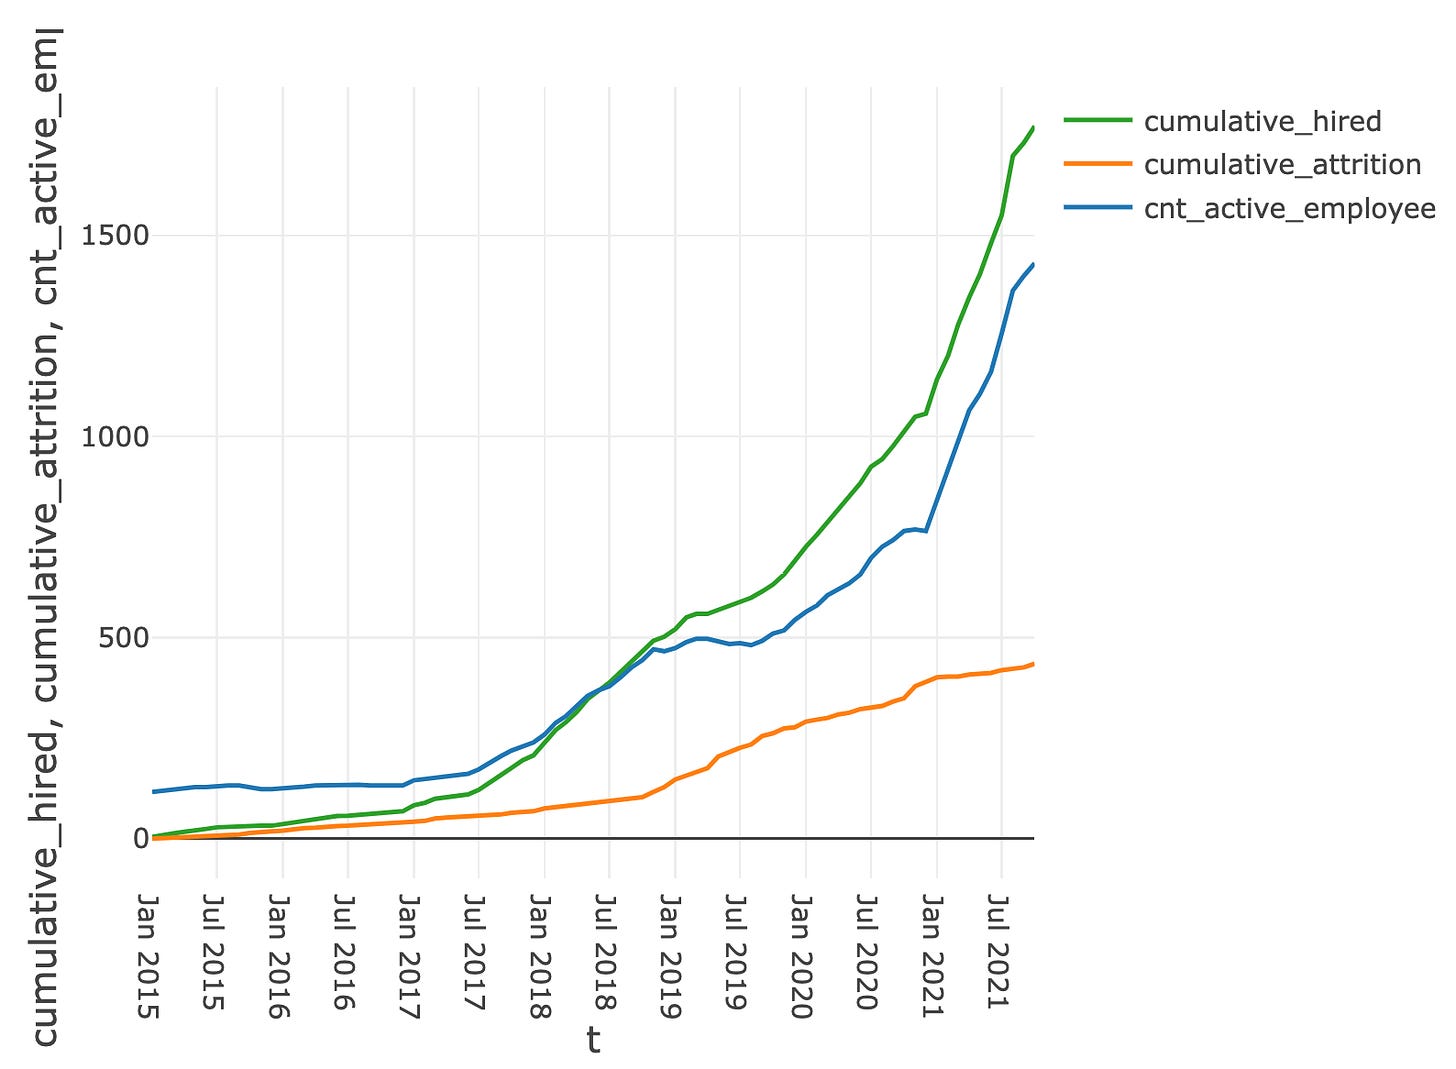
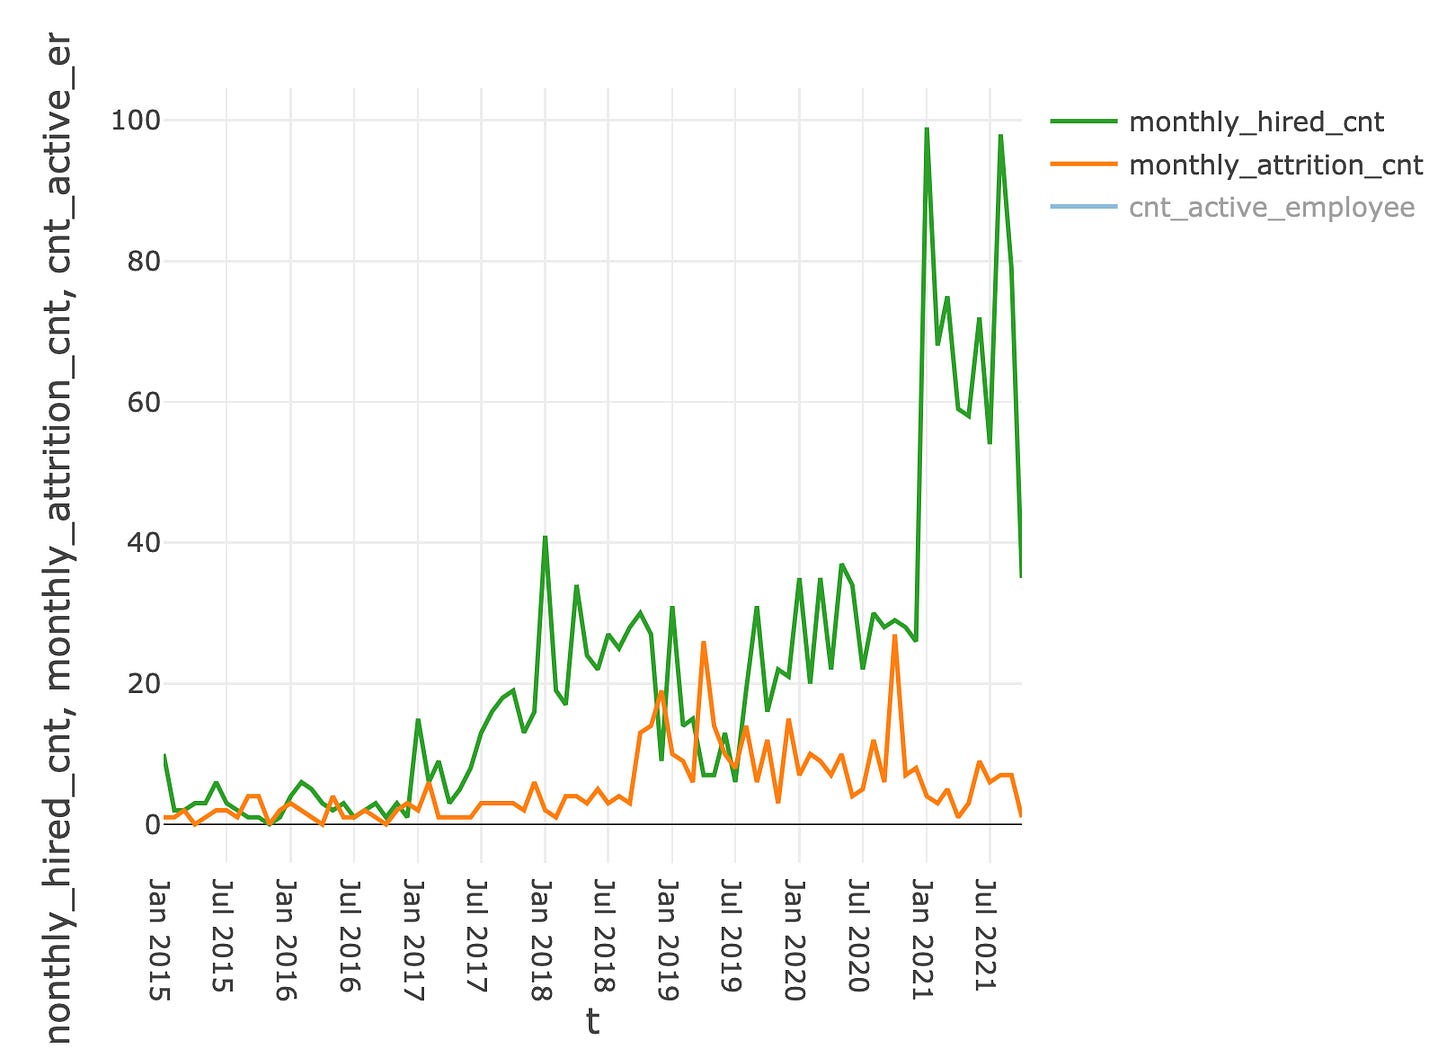
Figure 2 shows the cumulative hire, attrition and employee count. Figure 3 shows the monthly hire and attrition count.
Active employee count stayed relatively flat over the first half of 2019, despite the employee exodus observed from Figure 1. Because hiring was able to catch up the attrition.
Raw monthly hiring count stayed consistently between 20 and 40 beginning 2018 to end of 2020, except for the first half of 2019, where monthly new hires are around 10.
Combined with figure 1, I hypothesize that since Coinbase was going through employee hyper-growth chaotic mode in 2018 and they were overwhelmed with new employees, and didn’t do a good job with onboarding, training, and integrating (hence the initial drop in retention). However, they were able to learn from the first year’s mistakes and make new changes accordingly, which helped them regain the growth traction.
I hypothesize the critical learning and change moment was done sometime in first half of 2019 too. Because these type of organizational culture shifts really take time.
I took a look at notable senior hires on LinkedIn Insights on Coinbase company page. The earliest senior hire I can trace to is the Chief Product Officer hire in Feb 2020. I wonder if the data is available, who were the senior leaders that were able to help the Management team (or Armstrong himself) debugged the hyper growth code.
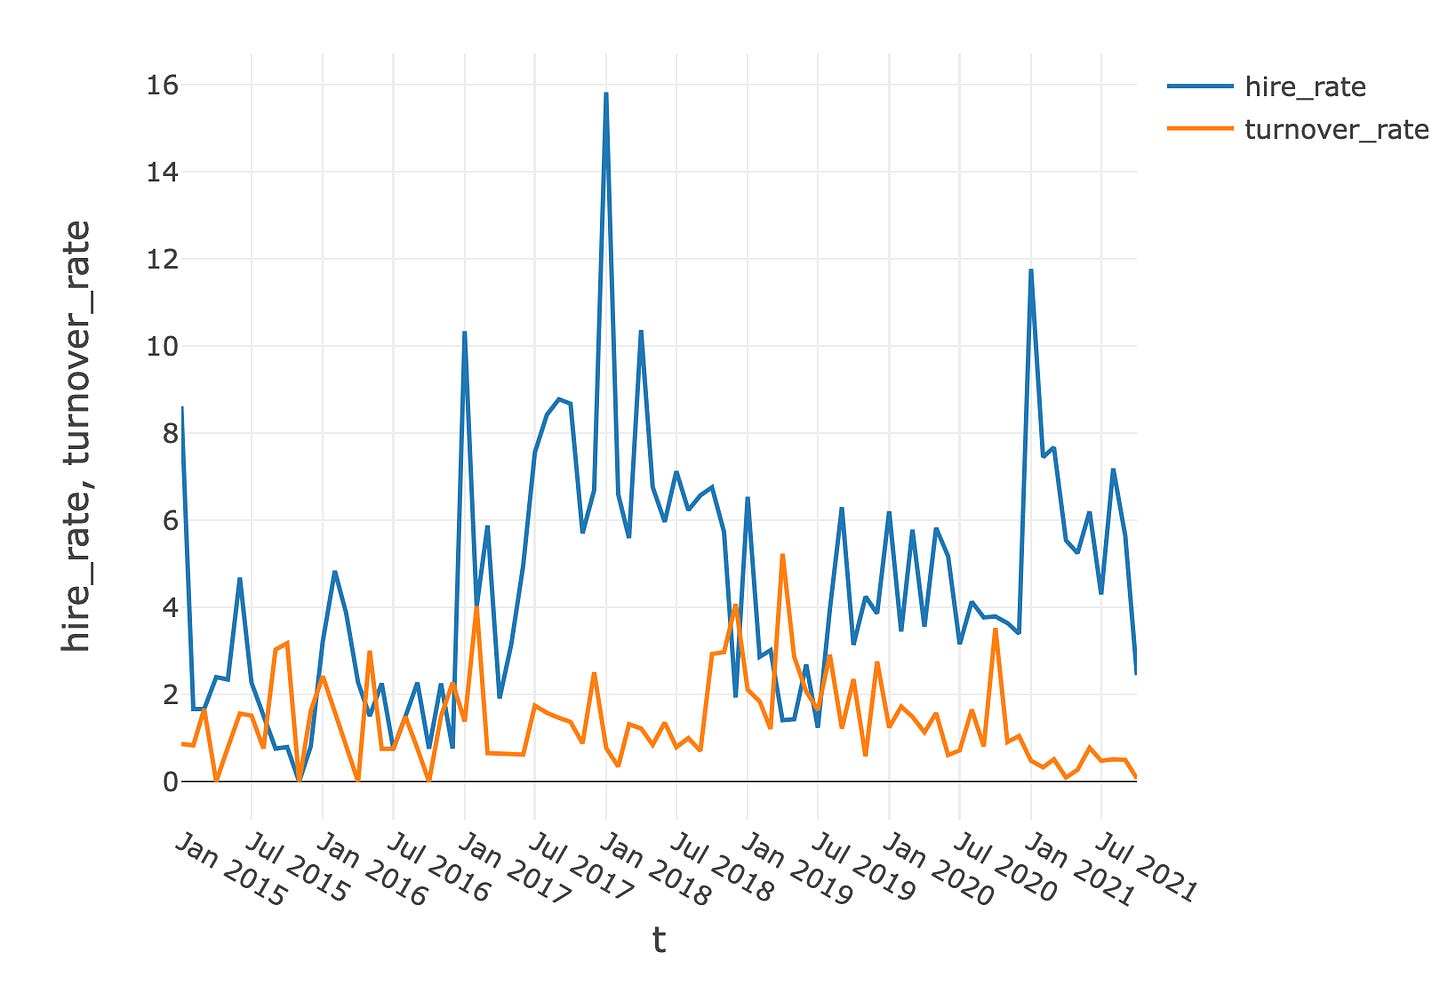
Figure 4 is hiring rate and attrition (turnover) rate, ie. the numbers in figure 3 divided by the number of active employees in the company at that time.
Now you can really see the relative size of hyper growth: ~8% monthly head count growth rate since July 2017, and >6% consistently through Oct 2018. If we take 7% as the monthly growth rate and calculate the raw growth in 16 months (7/2017 to 10/2018) 1.07^16 = 2.95, so nearly tripling the workforce. This can be very chaotic…. Glad they survived


